Projects
Data Manipulation and Visualization
📈 Google Merchandise Store Dashboard
Google Analytics, BigQuery, Tableau
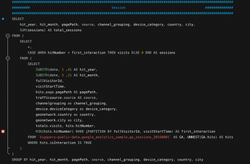
Extract-transform-load (ETL) Google Analytics data (1.4 million records) in BigQuery on Google Cloud Platform (GCP).
Use BigQuery to analyze Google Analytics data and calculate Google Analytics metrics, get hit-level data nested in ga_sessions, export BigQuery tables to Google Cloud Storage then download to local drive.
Built dynamic dashboards with KPIs for acquisition, activation and retention, such as monthly or yearly traffic (total sessions, average pageviews, average duration on page) per source and per location, acquisition amounts per channel, and bounce rate per page. Applied filters and parameters accordingly for segmentation analysis and comparison analysis.
 GMS.png |  GMS KPI.png |  GMS_Pageview.png |
|---|---|---|
 GMS_Time on Page.png |  GMS_Bounce.png |  GMS_Session.png |
📈 Retail Business Analysis
Power BI, DAX, Calculation Groups
· Gathered reporting requirements from different functional teams and converted these requirements into metrics.
· Cleaned and transformed data with Query Editor, built a robust data model from 7 dimensional tables and 1 fact table, used DAX and calculation groups to create metrics.
· Visualized data into trend dashboard with slicers and KPIs to cater different focuses from different groups, such as VP of Sales, Finance Manager, Product Manager, Marketing Director, etc.
 Retail Trend Analysis_Page 1.jpg |  Retail Trend Analysis_Page_2.jpg |  Retail Trend Analysis_Page_3.jpg |
|---|---|---|
 Retail Trend Analysis_Page_4.jpg |  Retail Trend Analysis_Page_5.jpg |
📈 Toronto Neighbourhood Rating
Power BI, DAX, 365 Automation
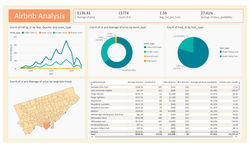
Cleaned and processed open source dataset using Power Query. Created calculated measures and calculated columns in Power BI with DAX to analyze aggregated values in the dataset, such as average pricing of the Airbnb listings in each neighbourhood.
Transposed and merged queries in Power BI to re-organized dataset. Used DAX functions -VAR, RETURN, IF to create Income score, Crime score, Diversity score, Airbnb score. Used What-if Parameters to create Weight for each criteria. Used RANKX function to return the ranking of neighbourhood based on weighted criteria.
Created a cloud flow to automate a Survey-to-Rank Neighbourhood Rating tool with 365 Automation. Based on the rating analysis, with dynamic ratings generated from online form, the rating report ranked Toronto’s neighbourhood based on survey results.
 Neighborhood Rating_Page_1.jpg |  Neighborhood Rating_Page_2.jpg |  Neighborhood Rating_Page_3.jpg |
|---|---|---|
 IMG_3384_edited.jpg |
📈Home Credit Default Risk Prediction
SQL, Machine Learning, Python
Performed exploratory data analysis (EDA) across 7 tables, 3 data sources from Home Credit (a multi-national non-bank financial institution with 110,000 employees). Created a dataset that includes 300,000 records using SQL, calculated credit-to-income ratio, average income, flattened the database, checked numbers of bad debt and refused accounts, etc.
Cleaned data by removing empty records using Python and transformed categorical variables into dummy variables using one-hot encoding. Developed a credit score to predict default for Home Credit using Python Pandas and Scikit-Learn.
Implemented and compared Logistic Regression and Random Forest models, the performance of the later model is 8.2% higher.
 Logistic Regression Model.png |  Random Forest Model.png |
|---|


.png)
